
When a feeder trips, a hurricane approaches, a solar farm requests interconnection, or a third party strikes a gas main, GIS is part of the response. At many energy utilities, the enterprise geospatial system supports engineering, outage and emergency response, vegetation management, leak survey and inspection, planning, and executive reporting. Esri positions ArcGIS for electric utilities as a system of record, a system of engagement, and a system of insight. For gas utilities, Esri describes ArcGIS as a comprehensive GIS that maintains key information for natural gas distribution mapping and analysis.
That raises the stakes on how the platform is run. Electric utilities with bulk power system facilities work within mandatory reliability standards that NERC develops and FERC approves and enforces. Distribution teams measure reliability through SAIDI and SAIFI while integrating data from distributed energy resources (DER), Advanced Metering Infrastructure (AMI), and Advanced Distribution Management Systems (ADMS). Gas distribution operators must maintain integrity management programs under pipeline safety regulations administered by the Pipeline and Hazardous Materials Safety Administration (PHMSA). Moving servers to the cloud is not, by itself, modernization. The question is whether the utility can trust the network model, depend on the workflows built on it, and operate the platform to the standard the network requires.
This guide is written for GIS specialists and managers, IT leaders, CIOs, CTOs, and CISOs, engineering and operations leadership, and the buying committees that evaluate these platforms. It moves from operational requirements to the decisions that follow, including what the ArcGIS Cloud Services Specialty signals.
1. What Your GIS Should Be Doing
A modern energy utility GIS should provide an authoritative, connected network model that people use in daily work. Poles, distribution lines, transformers, reclosers, sectionalizers, and substations on the electric side, and mains, services, valves, regulator stations, and cathodic protection assets on the gas side, carry location and connectivity relationships. Geospatial network modeling captures both: where an asset sits and how the commodity moves through it, from source to customer.
Esri notes that early utility GIS programs focused on replicating paper maps, so precise network modeling came second. A network-based GIS goes further. On the electric side, a connectivity trace identifies what sits upstream or downstream of a device, which customers a feeder serves, and how a load transfer between circuits would change service. On the gas side, an isolation trace identifies how to isolate an equipment failure and which customers it affects.
Engineering, planning, and customer service teams then work from current network information rather than parallel spreadsheets, and leaders can see where asset criticality and condition intersect.
The underlying requirement is trust. ADMS, outage management systems (OMS), gas operational systems, and hydraulic models inherit whatever the GIS contains; Esri notes that GIS supplies the geometries and asset descriptions, such as material and diameter, used to build a pipe network’s hydraulic model.
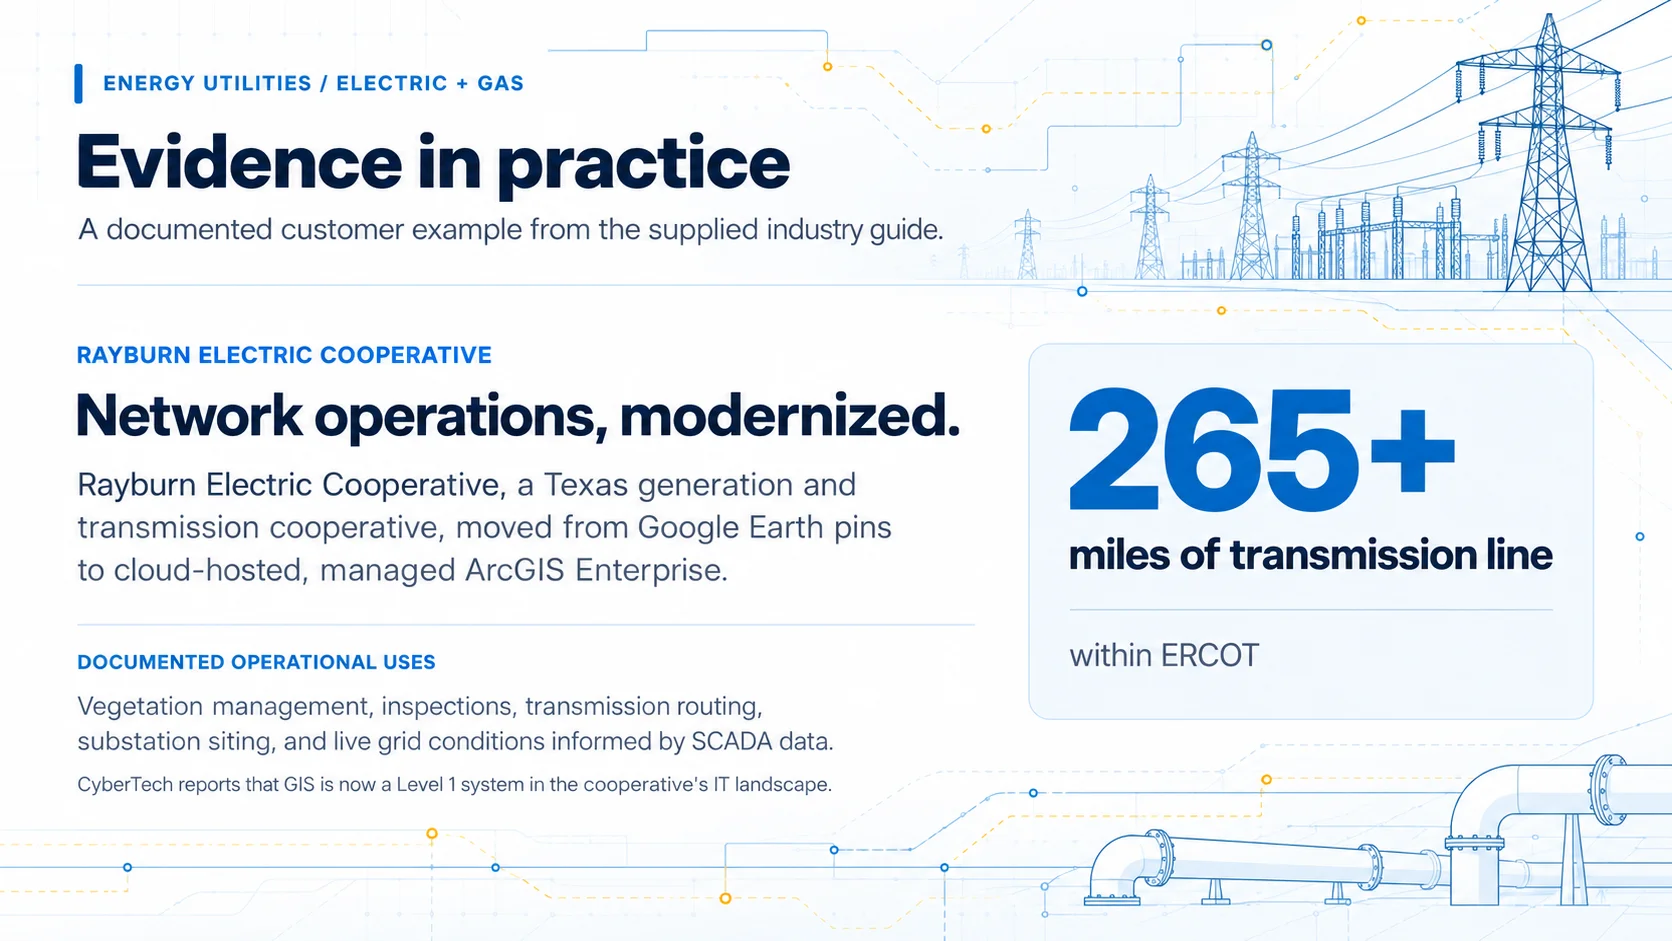
Evidence in practice: Rayburn Electric Cooperative, a Texas generation and transmission cooperative with more than 265 miles of transmission line within ERCOT, moved from pins on Google Earth to a cloud-hosted, managed ArcGIS Enterprise system that CyberTech reports is now a Level 1 system in the cooperative’s IT landscape. GIS supports vegetation management, inspections, transmission line routing, substation siting, and live grid conditions, with data ingested from SCADA.
2. Where Energy Utility GIS Environments Break Down
Energy utility GIS environments rarely fail through a single event. Complexity accumulates as applications are added for inspections, leak survey, or storm response, integrations multiply, and undocumented workarounds spread. Most utilities must modernize while keeping the systems and data behind daily operations running.
Symptoms usually appear before a serious incident. A transformer or regulator station may be recorded differently in GIS than in the asset registry or compliance records. Field changes may return as paper redlines or email. ArcGIS Desktop, including ArcMap, retired on March 1, 2026, and CyberTech observes that the harder migration problem often sits around ArcMap rather than inside it: connectors, custom plug-ins, and undocumented corrections that other enterprise systems quietly depend on.
ArcGIS Utility Network enforces network rules, attribute rules, and validation; in Esri’s example, a medium-voltage transformer cannot be connected to a high-voltage line. Esri documents the same discipline for gas and pipeline data and notes that not every data quality problem produces an error, so subnetwork quality assurance is used to confirm features are connected and traceable. Rules surface problems; they do not supply accurate source data, ownership, or editing standards.
The consequence of drift differs by commodity. On the electric side, a model that does not reflect field reality degrades tracing, switching, and outage prediction. On the gas side, it affects isolation decisions and any integrity records the GIS supports; PHMSA requires distribution operators to keep records demonstrating compliance with 49 CFR Part 192, Subpart P for at least ten years. A current-state assessment should start with the six areas below.
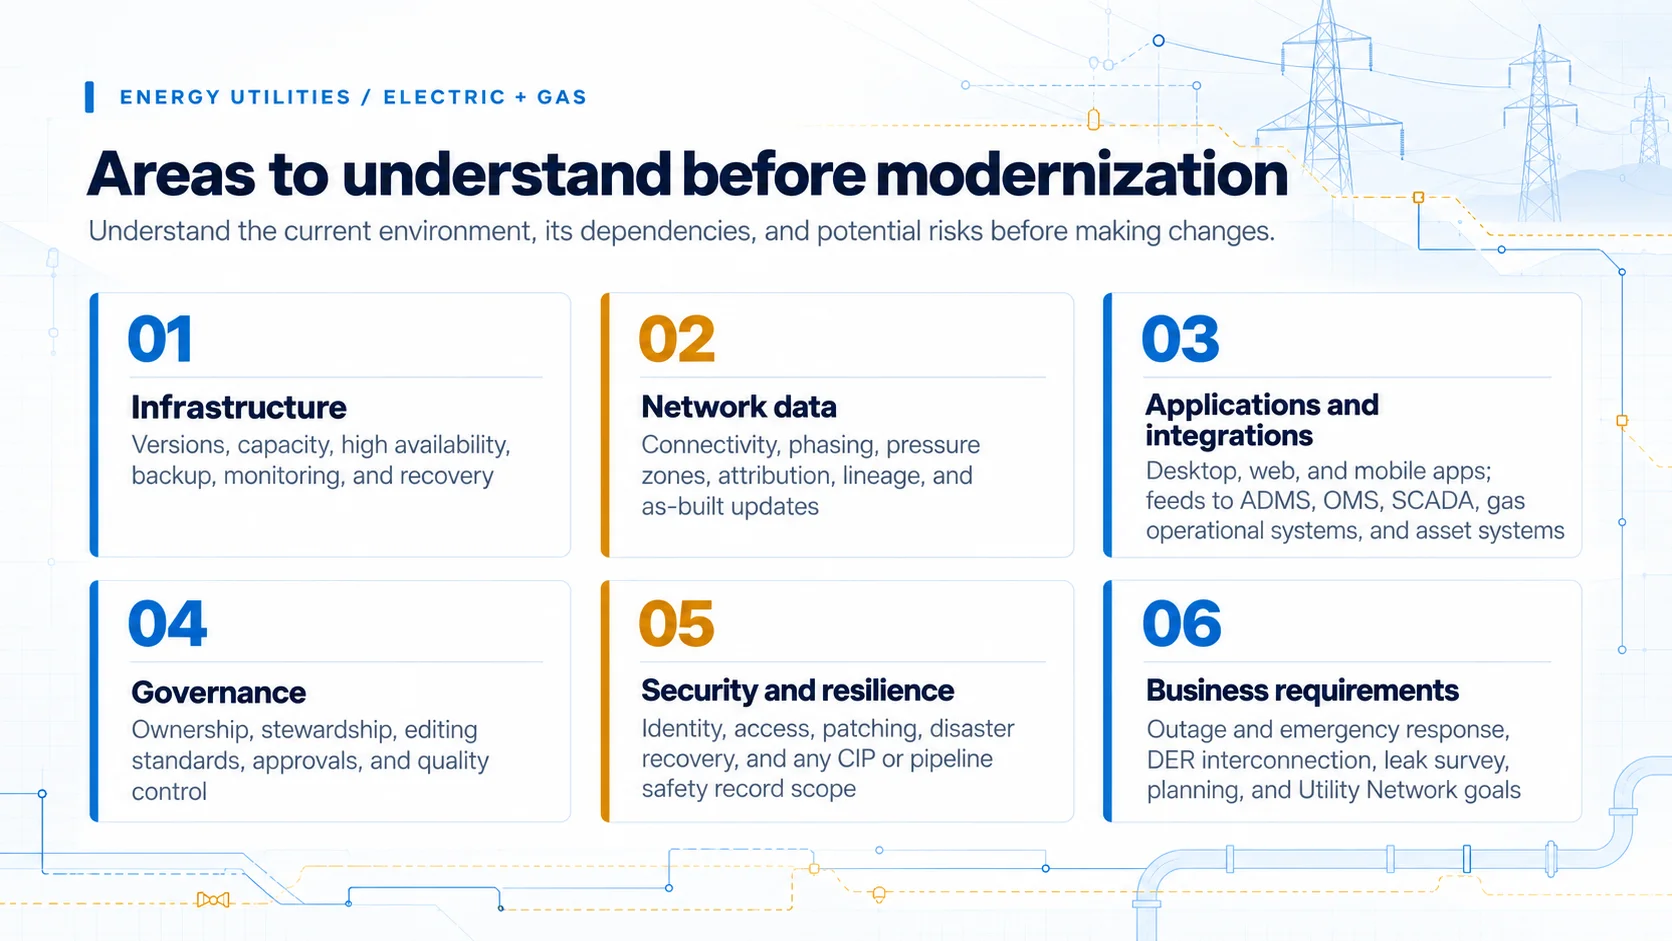
Six areas to understand before modernization
What the environment supports today, and what could create operational risk during change.
3. GIS in Daily Operations
The strongest test of an energy utility GIS is what happens during routine work and when conditions deteriorate.
During an electric outage, dispatchers need to locate the affected device, trace which circuit and customers are de-energized, identify switching options, and coordinate crews. Esri describes ArcGIS as presenting a common operational picture that communicates network changes as they occur. Switching orders and load transfers during restoration depend on a model that reflects field reality.
During a gas emergency, the question changes: which valves isolate the affected segment, and which customers sit downstream of them? Isolation tracing answers it. Esri’s gas operations guidance pairs that capability with enforcing the integrity of network and structural data.
Inspection and maintenance work is largely shared across commodities. Crews using mobile GIS need asset history and a reliable path for returning changes, whether the observation is a pole inspection, a vegetation finding, a leak survey result, or a cathodic protection reading. Condition-based maintenance, and later predictive maintenance or remaining useful life estimates, depend on attaching each observation to the right asset.
Capital and capacity planning combine load forecasts, feeder studies, contingency analysis, and asset age on the electric side, and pressure zone performance, pipe material, and integrity threat identification on the gas side. Grid modernization, which DOE frames as delivering resilient, reliable, flexible, secure, sustainable, and affordable electricity, adds electric workload. Rooftop solar PV, battery energy storage systems (BESS), demand response, and virtual power plants change how power flows on feeders, and DERMS and distribution automation platforms need to know where those resources and devices connect. Esri positions ArcGIS Utility Network as modeling the grid as it exists on the ground while bridging IT and operational technology (OT) data.
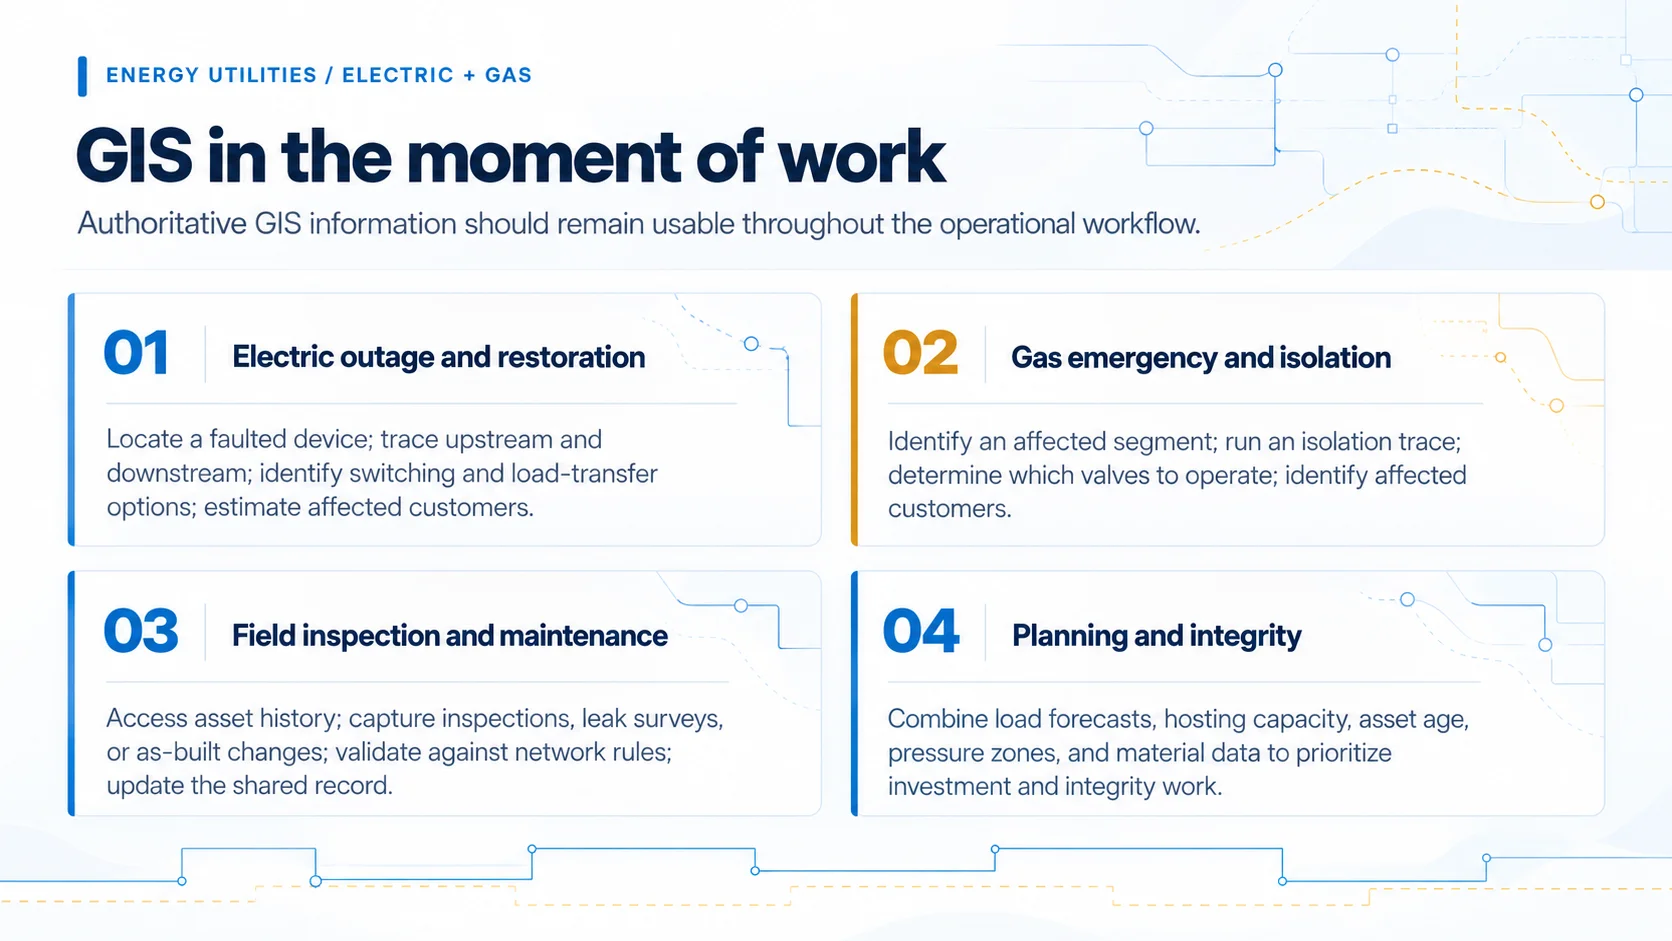
GIS in the moment of work
GIS proves its value when authoritative network information stays usable across the full workflow.
4. The Decisions You’ll Face
Modernization is a sequence of decisions. Four most strongly shape risk, scope, and the long-term support model.
4.1 Where should the platform run?
Start with requirements, not a default preference. Esri states that ArcGIS Enterprise in the cloud has the same features and tools as an on-premises deployment, and describes a spectrum from lift-and-shift migration to cloud-optimized architecture, including hybrid patterns such as an on-premises primary deployment with a periodically updated cloud standby. Esri’s Architecture Center adds that organizational experience should guide the choice of cloud provider.
Energy utility requirements typically include storm-season availability, recovery objectives for outage- and emergency-critical services, tracing performance, and security controls. NERC’s Critical Infrastructure Protection (CIP) standards set cybersecurity requirements for systems that support reliable operation of the Bulk Electric System. Whether any part of a GIS environment falls within CIP scope or holds records relied on for pipeline safety compliance depends on how the utility categorizes its systems, so compliance teams belong in the architecture decision.
Esri identifies partners holding the ArcGIS Cloud Services Specialty as having expertise in cloud deployment, system architecture, managed services, and integrated ArcGIS Enterprise solutions. CyberTech was the first Esri partner to earn it, in June 2020. It is a useful qualification to weigh alongside the proposed architecture and comparable energy experience.
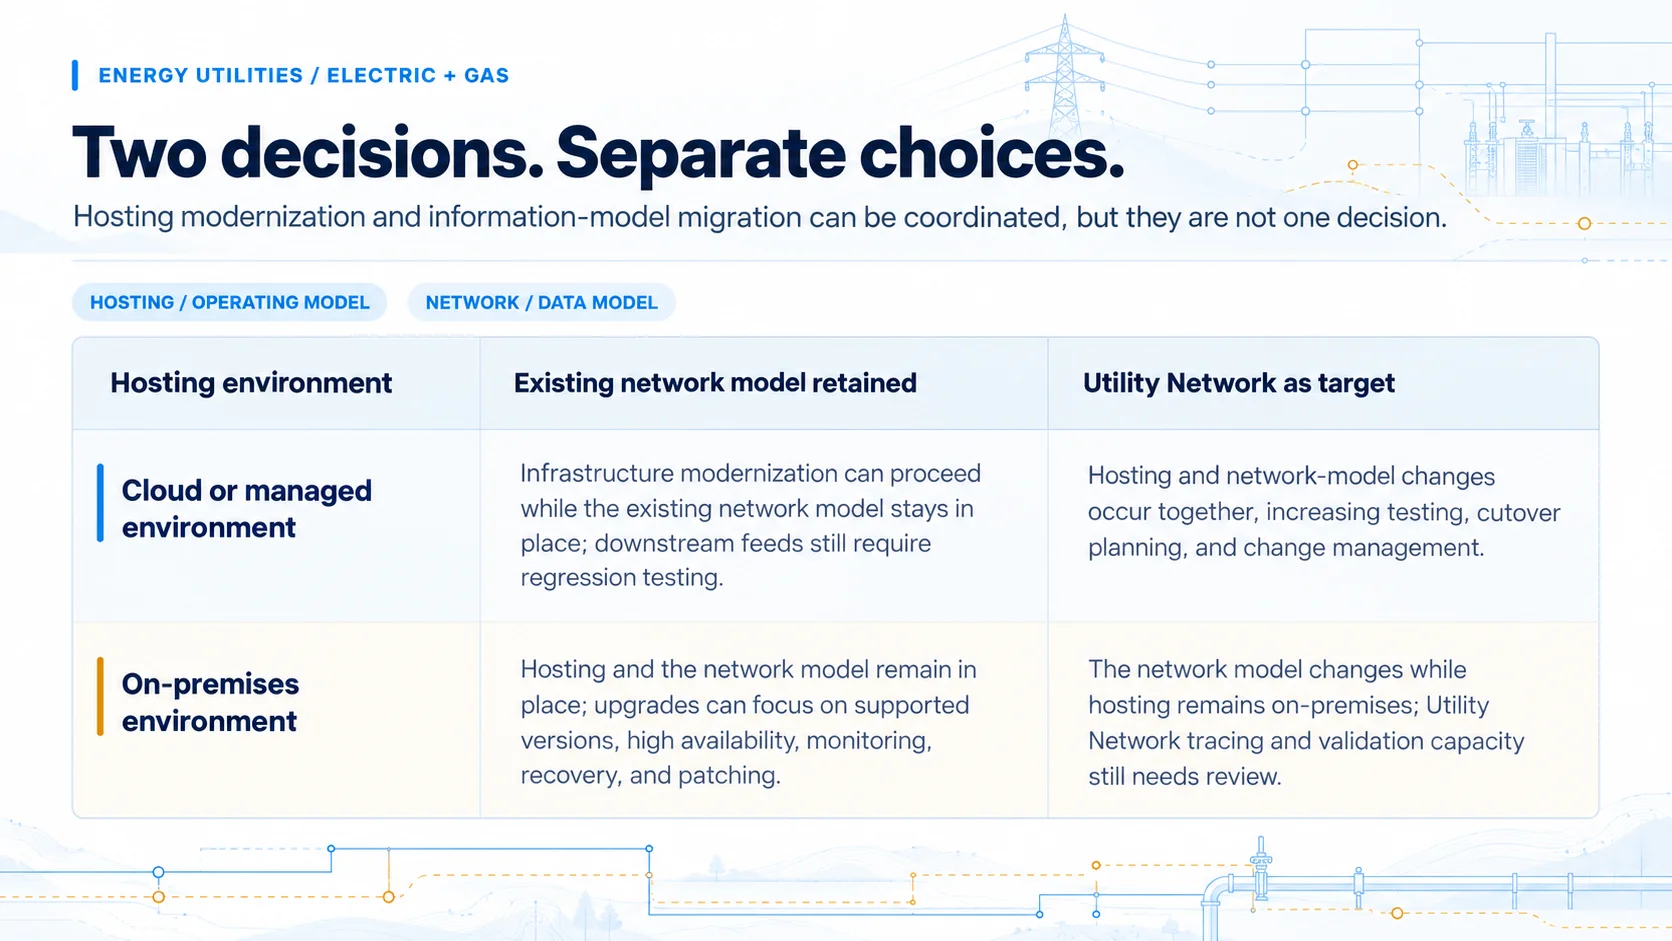
Two decisions that should not automatically become one
Hosting and network model changes can be coordinated without moving at the same time.
| Deployment | Existing network model retained | Utility Network as target |
|---|---|---|
| Cloud or managed environment | Infrastructure modernization proceeds while the existing model stays in place; downstream feeds still need regression testing. | Changes to hosting and the network model occur together, increasing testing, cutover planning, and change management. |
| On-premises environment | Hosting and the network model stay in place; modernization can still address supported versions, high availability, monitoring, recovery, and patching. | The model changes while hosting stays local; sizing for Utility Network tracing and validation still needs review. |
4.2 Utility Network: whether, when, and how far
ArcGIS Utility Network is a network-management and workflow decision, not only a data conversion. It is service-based and supports schematics, containment, generation-to-customer modeling, connectivity and tracing, network rules, and 3D. Because those services run on ArcGIS Enterprise, the decision is linked to 4.1, though not bound to its schedule.
Gas adds a scoping question. Esri notes that gas and pipeline customers often maintain these datasets in multiple databases, and that combining them into a single connected network is a key benefit, but one with requirements to weigh before committing. Subnetworks represent systems of connectivity: feeder-based systems on the electric side, and gathering, transmission, and distribution systems plus pressure zones on the gas side.
Readiness depends on connectivity, phasing, and pressure zone quality; how feeders or pressure zones become subnetworks; dependent applications and integrations; workflows that cannot be interrupted; and testing before cutover. CyberTech describes a phased approach of data readiness assessment, implementation planning, a pilot or proof-of-concept migration, and production migration.
4.3 Who should run the platform?
The operating model should assign responsibility by layer: who owns the cloud subscription; who administers, monitors, patches, and upgrades ArcGIS Enterprise; who manages backups, tests recovery, and handles incidents; and who approves production changes. Esri distinguishes ArcGIS Enterprise, which is software, from SaaS such as ArcGIS Online, which Esri hosts and manages. Enterprise in the cloud still needs an operator.
CyberTech’s Managed ArcGIS Cloud Services (MACS) illustrate two ways to divide that work: MACS White Glove is a turnkey subscription hosted on CyberTech’s cloud, while MACS Advanced operates within the customer’s chosen cloud. Both include 24x7 monitoring with service-level agreements and a three-layer DataSafe security approach.
At Rayburn Electric Cooperative, CyberTech hosts and manages ArcGIS Enterprise on Microsoft Azure, with workloads distributed across multiple servers for high availability and ArcGIS Monitor tracking server and service performance. The cooperative’s two-person GIS team can focus on data, analysis, and new applications. No single model is universally better; ownership must be explicit.
4.4 What connects to what?
Enterprise integration is primarily an ownership decision. Esri distinguishes ERP transactions, such as work execution, from GIS, which manages how asset attributes relate to location. On the electric side, ADMS depends on GIS for the network model, SCADA, AMI, and meter data management (MDM) supply operational data, and OMS links customer calls to topology. On the gas side, the same question applies across work management, SCADA and pressure monitoring, customer systems, hydraulic models, and integrity records.
For each integration, define which system owns each record, which direction updates move, whether synchronization occurs in real time or in batches, how failed transactions are handled, and who resolves exceptions. Without those decisions, integration can automate inconsistency as easily as it automates work.
CyberTech describes its Unity Engine as SAP-certified for SAP S/4HANA, synchronizing Equipment, Functional Location, Work Order, and Notification objects with ArcGIS and matching Utility Network connectivity data to related SAP records. That establishes capability, not an energy customer outcome.
5. Choosing a Partner and the Next 12 Months
Evaluate a partner against the environment the utility actually operates. Credentials verify capability, not delivery. Esri’s Partner Network profile lists CyberTech as a Platinum Partner with the ArcGIS Cloud Services, Network Management, State & Local Government, and Imagery specialties, identifies Electric & Gas among the industries it serves, describes Utility Network specialists serving electric and gas networks, and states that CyberTech manages more than 100 cloud environments.
Beyond credentials, ask for evidence from comparable electric or gas environments: how current-state dependencies, integrations, testing, and cutover were handled, and what the customer owned after go-live, including recovery, escalation, and production change governance.
The sequence will vary with budget cycles and readiness, but six decisions determine whether modernization can move safely into production.
What should be resolved over the next 12 months?
- Establish the current-state baseline. Document the ArcGIS environment, remaining ArcMap dependencies, network data condition, integrations, and recovery expectations.
- Set authoritative ownership. Define which system owns the network model, asset registry, work orders, customer records, and meter data, and how exceptions are resolved.
- Choose the target architecture. Decide where the platform runs and which availability targets, monitoring capabilities, recovery objectives, and change-management practices are required for storm and emergency response.
- Make the Utility Network decision. Confirm whether it is in scope now or later, based on data readiness, ADMS, DERMS, gas operational plans, and organizational capacity.
- Define the operating model. Make GIS, IT, OT, security, cloud provider, and partner responsibilities explicit before handoff, including CIP and pipeline safety record scope.
- Agree on outcomes. Choose measures tied to the business case, such as availability, recovery performance, field adoption, validation errors, or workflow cycle time.
Conclusion
For energy utilities, GIS modernization is ultimately about operational confidence: a network model that engineers, dispatchers, controllers, and downstream systems trust; enterprise connections that keep working through change; and a platform that stays available when the network is under stress, whether the event is a feeder fault during a storm or a damaged main that must be isolated.
The right starting point is not a migration date or a preferred cloud but a clear view of the current environment, the workflows that cannot fail, and the outcomes the utility needs to improve. From there, cloud, Utility Network, integration, and partner selection become connected decisions rather than isolated projects.
A practical starting point: CyberTech’s GIS Health Check is designed to evaluate performance, cost efficiency, data confidence, security and compliance, best practices, and future readiness. These findings can inform the current-state baseline described in Section 5.